[워크삽] AWS 트레니엄 워크삽(11)-관측 가능성
이번 블로그는 vLLM 배포를 위해 Prometheus, Grafana 및 CloudWatch를 사용한 모니터링을 구성한다.
1. 환경변수 설정
export AWS_REGION=us-west-2
export CLUSTER_NAME=vllm-trn1-eks-cluster
export MONITORING_NAMESPACE=monitoring

# Verify current namespace
kubectl config set-context --current --namespace=default
2. 모니터링 네임스페이스 생성
kubectl create namespace $MONITORING_NAMESPACE
3. Helm을 사용한 Prometheus 설치
# Add Prometheus Helm repository
helm repo add prometheus-community https://prometheus-community.github.io/helm-charts
helm repo update

# Create custom values for Prometheus
cat > prometheus-values.yaml <<EOF
server:
  persistentVolume:
    enabled: false
  retention: "15d"
  resources:
    requests:
      cpu: 500m
      memory: 1Gi
    limits:
      cpu: 1000m
      memory: 2Gi
  global:
    scrape_interval: 15s
    evaluation_interval: 15s

alertmanager:
  enabled: true
  persistentVolume:
    enabled: false

# Enable node exporter for node metrics
nodeExporter:
  enabled: true

# Enable kube-state-metrics for Kubernetes metrics
kubeStateMetrics:
  enabled: true

# Scrape configuration
serverFiles:
  prometheus.yml:
    scrape_configs:
    - job_name: 'kubernetes-pods'
      kubernetes_sd_configs:
      - role: pod
      relabel_configs:
      - source_labels: [__meta_kubernetes_pod_annotation_prometheus_io_scrape]
        action: keep
        regex: true
      - source_labels: [__meta_kubernetes_pod_annotation_prometheus_io_path]
        action: replace
        target_label: __metrics_path__
        regex: (.+)

    - job_name: 'vllm-metrics'
      static_configs:
      - targets: ['vllm-service.default.svc.cluster.local:8080']
      metrics_path: '/metrics'
      scrape_interval: 10s
EOF

# Install Prometheus
helm install prometheus prometheus-community/prometheus \
  --namespace $MONITORING_NAMESPACE \
  --values prometheus-values.yaml
4. Helm을 사용한 Grafana 설치
# Add Grafana Helm repository
helm repo add grafana https://grafana.github.io/helm-charts
helm repo update

# Create custom values for Grafana
cat > grafana-values.yaml <<EOF
persistence:
  enabled: false

adminPassword: "vllm-admin-2024"

service:
  type: ClusterIP

datasources:
  datasources.yaml:
    apiVersion: 1
    datasources:
    - name: Prometheus
      type: prometheus
      url: http://prometheus-server.monitoring.svc.cluster.local
      access: proxy
      isDefault: true

dashboardProviders:
  dashboardproviders.yaml:
    apiVersion: 1
    providers:
    - name: 'default'
      orgId: 1
      folder: ''
      type: file
      disableDeletion: false
      editable: true
      options:
        path: /var/lib/grafana/dashboards/default

dashboards:
  default:
    kubernetes-cluster:
      gnetId: 7249
      revision: 1
      datasource: Prometheus
    kubernetes-pods:
      gnetId: 6336
      revision: 1
      datasource: Prometheus

resources:
  requests:
    cpu: 250m
    memory: 512Mi
  limits:
    cpu: 500m
    memory: 1Gi
EOF

# Install Grafana
helm install grafana grafana/grafana \
  --namespace $MONITORING_NAMESPACE \
  --values grafana-values.yaml
5. vLLM 대시보드 JSON 파일 생성
# Create vLLM dashboard JSON file with correct metric names
cat > vllm-dashboard.json <<'EOF'
{
  "id": null,
  "title": "vLLM Inference Metrics",
  "description": "Dashboard for monitoring vLLM inference performance",
  "tags": ["vllm", "inference", "llm"],
  "timezone": "browser",
  "panels": [
    {
      "id": 1,
      "title": "Total Successful Requests",
      "type": "stat",
      "targets": [
        {
          "expr": "vllm:request_success_total",
          "legendFormat": "Total Requests"
        }
      ],
      "fieldConfig": {
        "defaults": {
          "unit": "short"
        }
      },
      "gridPos": {"h": 8, "w": 6, "x": 0, "y": 0}
    },
    {
      "id": 2,
      "title": "Running Requests",
      "type": "stat",
      "targets": [
        {
          "expr": "vllm:num_requests_running",
          "legendFormat": "Running"
        }
      ],
      "gridPos": {"h": 8, "w": 6, "x": 6, "y": 0}
    },
    {
      "id": 3,
      "title": "Waiting Requests",
      "type": "stat",
      "targets": [
        {
          "expr": "vllm:num_requests_waiting",
          "legendFormat": "Waiting"
        }
      ],
      "gridPos": {"h": 8, "w": 6, "x": 12, "y": 0}
    },
    {
      "id": 4,
      "title": "KV Cache Usage",
      "type": "gauge",
      "targets": [
        {
          "expr": "vllm:gpu_cache_usage_perc * 100",
          "legendFormat": "KV Cache Usage %"
        }
      ],
      "fieldConfig": {
        "defaults": {
          "unit": "percent",
          "min": 0,
          "max": 100,
          "thresholds": {
            "steps": [
              {"color": "green", "value": 0},
              {"color": "yellow", "value": 60},
              {"color": "red", "value": 80}
            ]
          }
        }
      },
      "gridPos": {"h": 8, "w": 6, "x": 18, "y": 0}
    },
    {
      "id": 5,
      "title": "Total Prompt Tokens",
      "type": "stat",
      "targets": [
        {
          "expr": "vllm:prompt_tokens_total",
          "legendFormat": "Prompt Tokens"
        }
      ],
      "gridPos": {"h": 8, "w": 6, "x": 0, "y": 8}
    },
    {
      "id": 6,
      "title": "Total Generated Tokens",
      "type": "stat",
      "targets": [
        {
          "expr": "vllm:generation_tokens_total",
          "legendFormat": "Generated Tokens"
        }
      ],
      "gridPos": {"h": 8, "w": 6, "x": 6, "y": 8}
    },
    {
      "id": 7,
      "title": "Request Success Over Time",
      "type": "timeseries",
      "targets": [
        {
          "expr": "vllm:request_success_total",
          "legendFormat": "Total Successful Requests"
        }
      ],
      "gridPos": {"h": 8, "w": 12, "x": 12, "y": 8}
    },
    {
      "id": 8,
      "title": "Token Generation Over Time",
      "type": "timeseries",
      "targets": [
        {
          "expr": "vllm:prompt_tokens_total",
          "legendFormat": "Prompt Tokens"
        },
        {
          "expr": "vllm:generation_tokens_total",
          "legendFormat": "Generated Tokens"
        }
      ],
      "gridPos": {"h": 8, "w": 24, "x": 0, "y": 16}
    }
  ],
  "time": {"from": "now-15m", "to": "now"},
  "refresh": "10s"
}
EOF
6. vLLM 대시보드를 Kubernetes로 가져오기
# Import vLLM dashboard from existing JSON file
kubectl create configmap vllm-dashboard \
  --from-file=vllm-dashboard.json \
  -n $MONITORING_NAMESPACE
7. Grafana에 대시보드 마운트
# Mount the vLLM dashboard ConfigMap into Grafana pod
kubectl patch deployment grafana -n $MONITORING_NAMESPACE --type='json' -p='[
  {
    "op": "add",
    "path": "/spec/template/spec/volumes/-",
    "value": {
      "name": "vllm-dashboard",
      "configMap": {
        "name": "vllm-dashboard"
      }
    }
  },
  {
    "op": "add",
    "path": "/spec/template/spec/containers/0/volumeMounts/-",
    "value": {
      "name": "vllm-dashboard",
      "mountPath": "/var/lib/grafana/dashboards/default/vllm-dashboard.json",
      "subPath": "vllm-dashboard.json"
    }
  }
]'
8. 지표 수집을 위한 vLLM 디플로이먼트 업데이트
# Update the vLLM deployment to expose metrics
kubectl annotate deployment vllm-deployment -n default \
  prometheus.io/scrape=true \
  prometheus.io/port=8080 \
  prometheus.io/path=/metrics
9. CloudWatch 대시보드 생성
cat > cloudwatch-dashboard.json <<EOF
{
  "widgets": [
    {
      "type": "metric",
      "properties": {
        "metrics": [
          ["AWS/ContainerInsights", "pod_cpu_utilization", "PodName", "vllm-pod", "Namespace", "default", "ClusterName", "$CLUSTER_NAME"],
          [".", "pod_memory_utilization", ".", ".", ".", ".", ".", "."]
        ],
        "period": 300,
        "stat": "Average",
        "region": "$AWS_REGION",
        "title": "vLLM Pod Resource Utilization"
      }
    },
    {
      "type": "metric",
      "properties": {
        "metrics": [
          ["AWS/ContainerInsights", "pod_network_rx_bytes", "PodName", "vllm-pod", "Namespace", "default", "ClusterName", "$CLUSTER_NAME"],
          [".", "pod_network_tx_bytes", ".", ".", ".", ".", ".", "."]
        ],
        "period": 300,
        "stat": "Average",
        "region": "$AWS_REGION",
        "title": "vLLM Network Traffic"
      }
    }
  ]
}
EOF

# Create the dashboard
aws cloudwatch put-dashboard \
  --dashboard-name "vLLM-EKS-Monitoring" \
  --dashboard-body file://cloudwatch-dashboard.json \
  --region $AWS_REGION
10. 모니터링 컴포넌트 확인
# Check all monitoring components
kubectl get pods -n $MONITORING_NAMESPACE
kubectl get pods -n amazon-cloudwatch
11. Grafana 대시보드 접근
# Access Grafana
kubectl port-forward -n $MONITORING_NAMESPACE svc/grafana 3000:80 &
echo "Grafana: http://localhost:3000 (admin/vllm-admin-2024)"
포트 포워딩이 실행되면 아래 링크를 클릭해 Grafana 대시보드에 접근할 수 있다.
다음 자격 증명을 사용한다.
- 사용자 이름:
admin - 비밀번호:
vllm-admin-2024
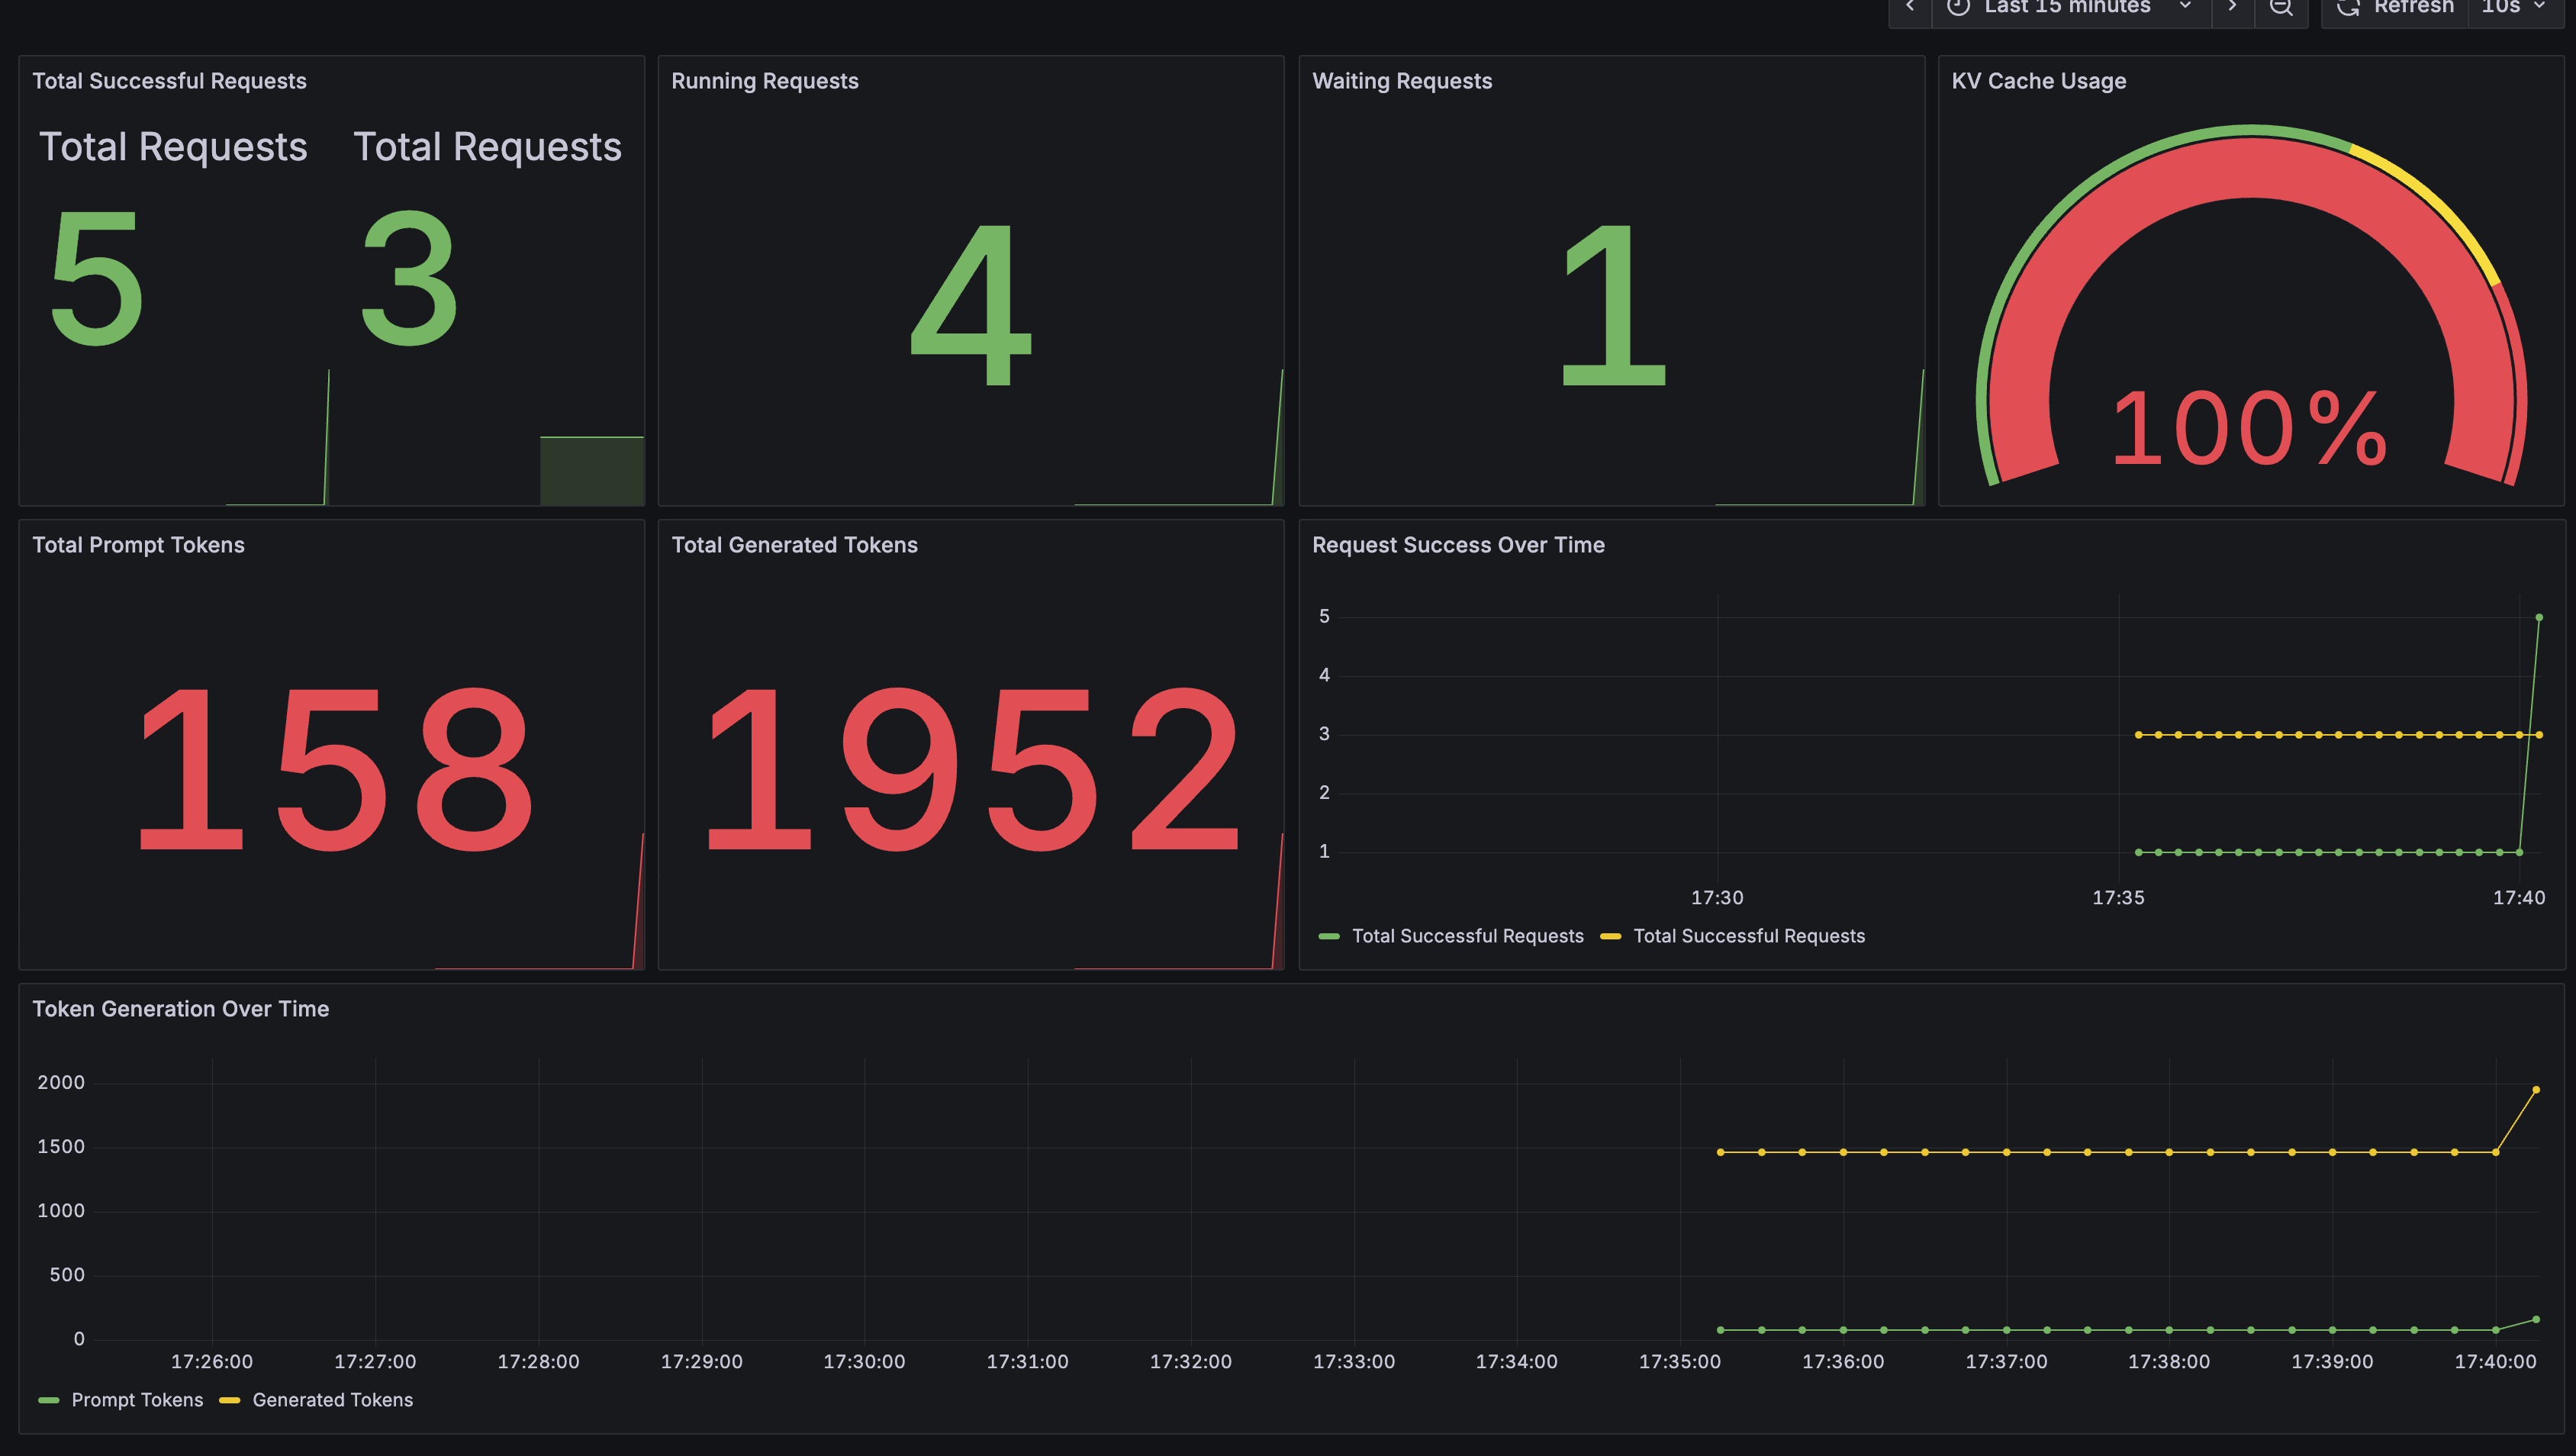
그런 다음 dashboards/vLLM Inference Metrics로 이동해 추론 지표, 요청 처리량 및 KV 캐시 사용량을 모니터링한다.
12. Prometheus 대시보드 접근
# Access Prometheus
kubectl port-forward -n $MONITORING_NAMESPACE svc/prometheus-server 9090:80 &
echo "Prometheus: http://localhost:9090"
포트 포워딩이 실행되면 아래 링크를 클릭해 Prometheus 대시보드에 접근할 수 있다.
13. Prometheus 쿼리 실행
특정 쿼리를 입력해 Prometheus 대시보드에서 vLLM 지표를 직접 살펴볼 수 있다. 다음은 확인해 볼 만한 vLLM 지표다.
vllm:prompt_tokens_total- 처리한 프롬프트 토큰의 총수vllm:time_to_first_token_seconds_sum- 모든 요청에서 첫 번째 토큰이 생성될 때까지 걸린 누적 시간
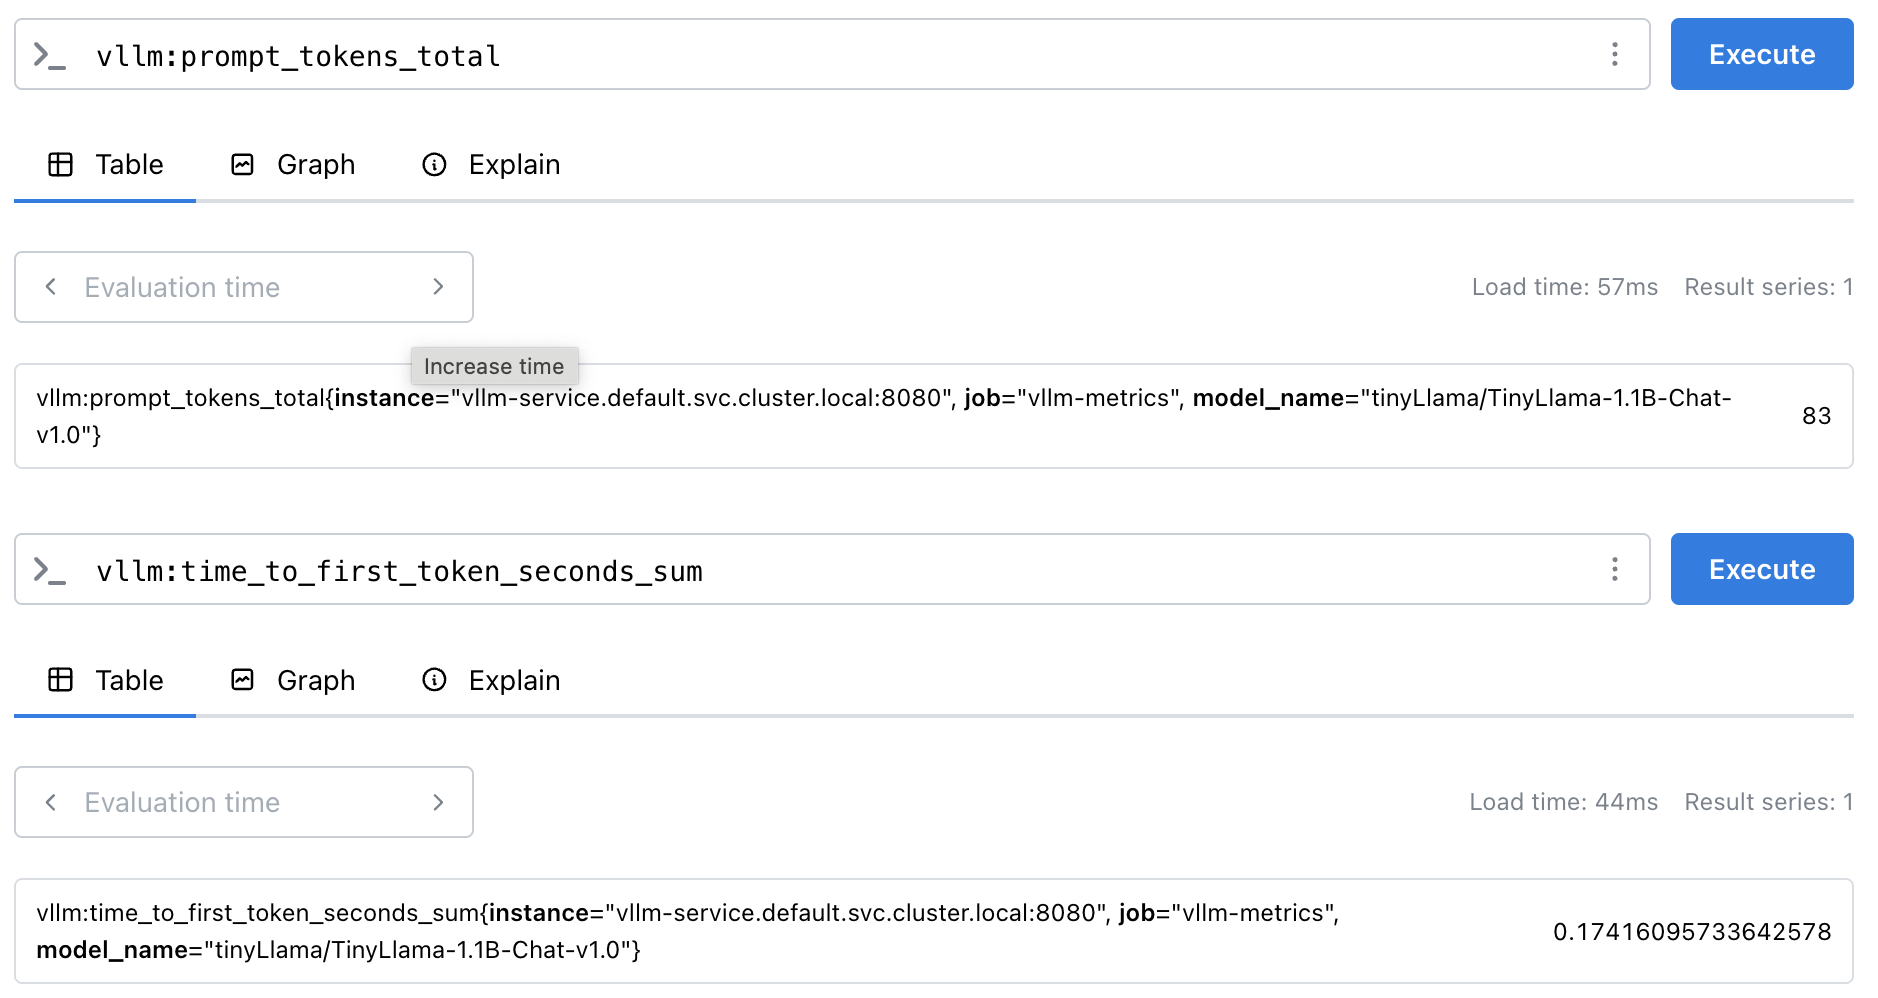
Prometheus Expression Browser에 이 쿼리를 입력하면 vLLM 배포의 실시간 지표를 확인할 수 있다. 이는 디버깅, 사용자 정의 알림 생성 또는 추가 대시보드 구축에 유용하다.
14. 관측 가능성 아키텍처 요약
이제 모니터링 구성에 다음 항목이 포함된다.
- Prometheus: 지표 수집 및 알림
- Grafana: 시각화 및 대시보드
- CloudWatch Container Insights: AWS 네이티브 모니터링
- 사용자 정의 대시보드: vLLM 전용 지표 시각화
15. 다음 단계
종합적인 모니터링 구성을 마쳤다. 다음으로 성능 테스트 섹션에서 부하가 걸린 상태의 성능과 스케일링 동작을 검증한다.
댓글남기기